sections
I where to begin: the beginning
I.a baseline: concepts and assumptions
II mortgage size + terms: smaller is better
II.a situation 1: rates vs price
III mortgage efficiency: when is ‘enough’, enough
III.a quick maths: a numbers review
IV moving towards real life: get your equity together
IV.a situation 2: damaging combo of rate and duration
IV.b situation 3: putting it all together, in real life
V conclusion: what have I gained from reading all this
V.a actionable takeaways: what to look for
where to begin:
the beginning
Purchasing a house is one of the largest financial decisions most of us will make; when searching for advice on buying a house there are all kinds steadfast advice that we never question. Commonplace advice such as put as much as you can into the down payment, negotiate the price of the house down, and build up your credit score before purchasing, are found on nearly every homebuyer website, book, and video course. Though how important are these really? American style fixed mortgages are property loans whose payments are fixed over their given duration with a predictable amortization curve that front loads interest payments. The duration of the mortgage and the interest rate of a mortgage are both significant factors of the mortgage terms that change the amortization curve and have exponential financial impacts on us. Since most of us need mortgages to purchase a house and cannot simply make an all cash purchase, the terms of the mortgage have a leveraged impact on our financial well-being (pun intended).
While these three example advices are helpful, there are two more important concepts that I would like to demonstrate in this article and build upon further:
1. The mortgage interest rate can be more important than the purchase price of the house.
2. It is better to take short duration mortgages in high interest rates and long duration mortgages in low interest rate.
I hope these concepts are actionable takeaways for you, but for them to have any sticking power we need to take a deep dive into the mathematics of mortgages to understand exactly why and what mechanisms are driving them. When we are properly equipped with the math we can take it a step further and gain an intuitive understanding of the dynamics of how wealth can be built or pilfered by owning a home with a mortgage. In this article we we start off by covering the some key concepts and assumptions, we will then begin by exploring the size of mortgages we can access, with that in hand we can build a powerful concept I would like to call Mortgage Efficiency, concluding the deep dive we will put together some key pieces to understand exactly how equity is built, and lastly, we will conclude by summarizing everything we have learned and tying these to a few examples of actionable takeaways that can significantly improve our financial well-being over the long run. Each section of the article will have real life examples to drive home the importance of the numbers and ideas that we uncover, these examples will be called situations.
For anyone who also wants to take a deep dive into the math or just wants to be able to reproduce the graphs in this article, all the code that I wrote for what we are discussing can be found on my github:
baseline:
concepts and assumptions
When we are all on the same page with the basics we can build upon more and more technical concepts in a more effective way, therefore before we begin I would like to lay out a few key concepts/assumptions of American style mortgages and home-buying that will help us:
i. A mortgage with higher interest rates results in a higher monthly payment that that same mortgage at a lower interest rate.
ii. Most folks estimate the size of the mortgage they can afford by estimating the fixed monthly payments (ability to pay monthly payments) and working backwards to estimate the total mortgage size.
iii. In American style fixed mortgages, the amortization curve dictates that early monthly payments are mostly go towards paying down interest and the later monthly payments are mostly go towards paying down the principal.
iv. Inflation is always present, $20 today has much less purchasing power than that same $20 did 30 years ago. Therefore, the same $20 with more purchasing power was ‘worth more’ in the past than it was today, and that same $20 today is ‘worth more’ than that same $20 in the future. Looking at that another way we can also say that that $20 in the future (which has less purchasing power) can be seen as being ‘cheaper’ than that same $20 today.
v. The most common terms of mortgages issued by American banks have durations of 15 years, 20 years, and 30 years. While any duration can be specified in the mortgage terms, these are the ones that most folks have access to by the industry standard offerings. Specific lenders may offer any duration, but since these three are the standard ones we will focus on them in the upcoming example situations.
vi. At the time of writing this article, mortgages interest rates started at a low of 2% a couple years ago (Jan 2022) to recently touching a high of 8% (Jan 2024). A lender can offer any interest rate, but these two values are currently in our recent collective memory and so will be used in the upcoming example situations.
vii. When the terms of a mortgage is referenced in this article, the terms are a specific reference to the combination of the length of the mortgage (its duration). and the interest rate of the mortgage (its rate).
Now with all of that out of the way lets start looking at some data!
mortgage size + terms:
smaller is better
Jumping straight into it, Graph 1 shows how large of a 30 year mortgage you can get access to for different monthly payments and interest rates. The way to read this is by first looking for the desired monthly payment on the horizontal x-axis, then available interest rate on the vertical y-axis, and once we have honed in on the point that these intersect on we have found our color. That color represents the size of the 30 year mortgage we can access for that specific combination of monthly payments and interest rates. The color bar on the right of the graph shows us the numbers that the colors correspond to. The size of the mortgage we can also refer to as the principal in this case, it does not account for any down payments and is only inclusive of the mortgages’ terms .
In Graph 1 there are three points highlighted, for the first example situation let’s look at the middle point. Looking at the horizontal x-axis we can see that that point is sitting at a monthly payment of $3,000.00 a month. Looking at the vertical y-axis, the point is sitting at an interest level of 2%. The point itself has the dollar value of $811,000.00, which means that if we can afford monthly payments of $3k, and the mortgage interest rate is 2%, then we can access a principal of $811k.
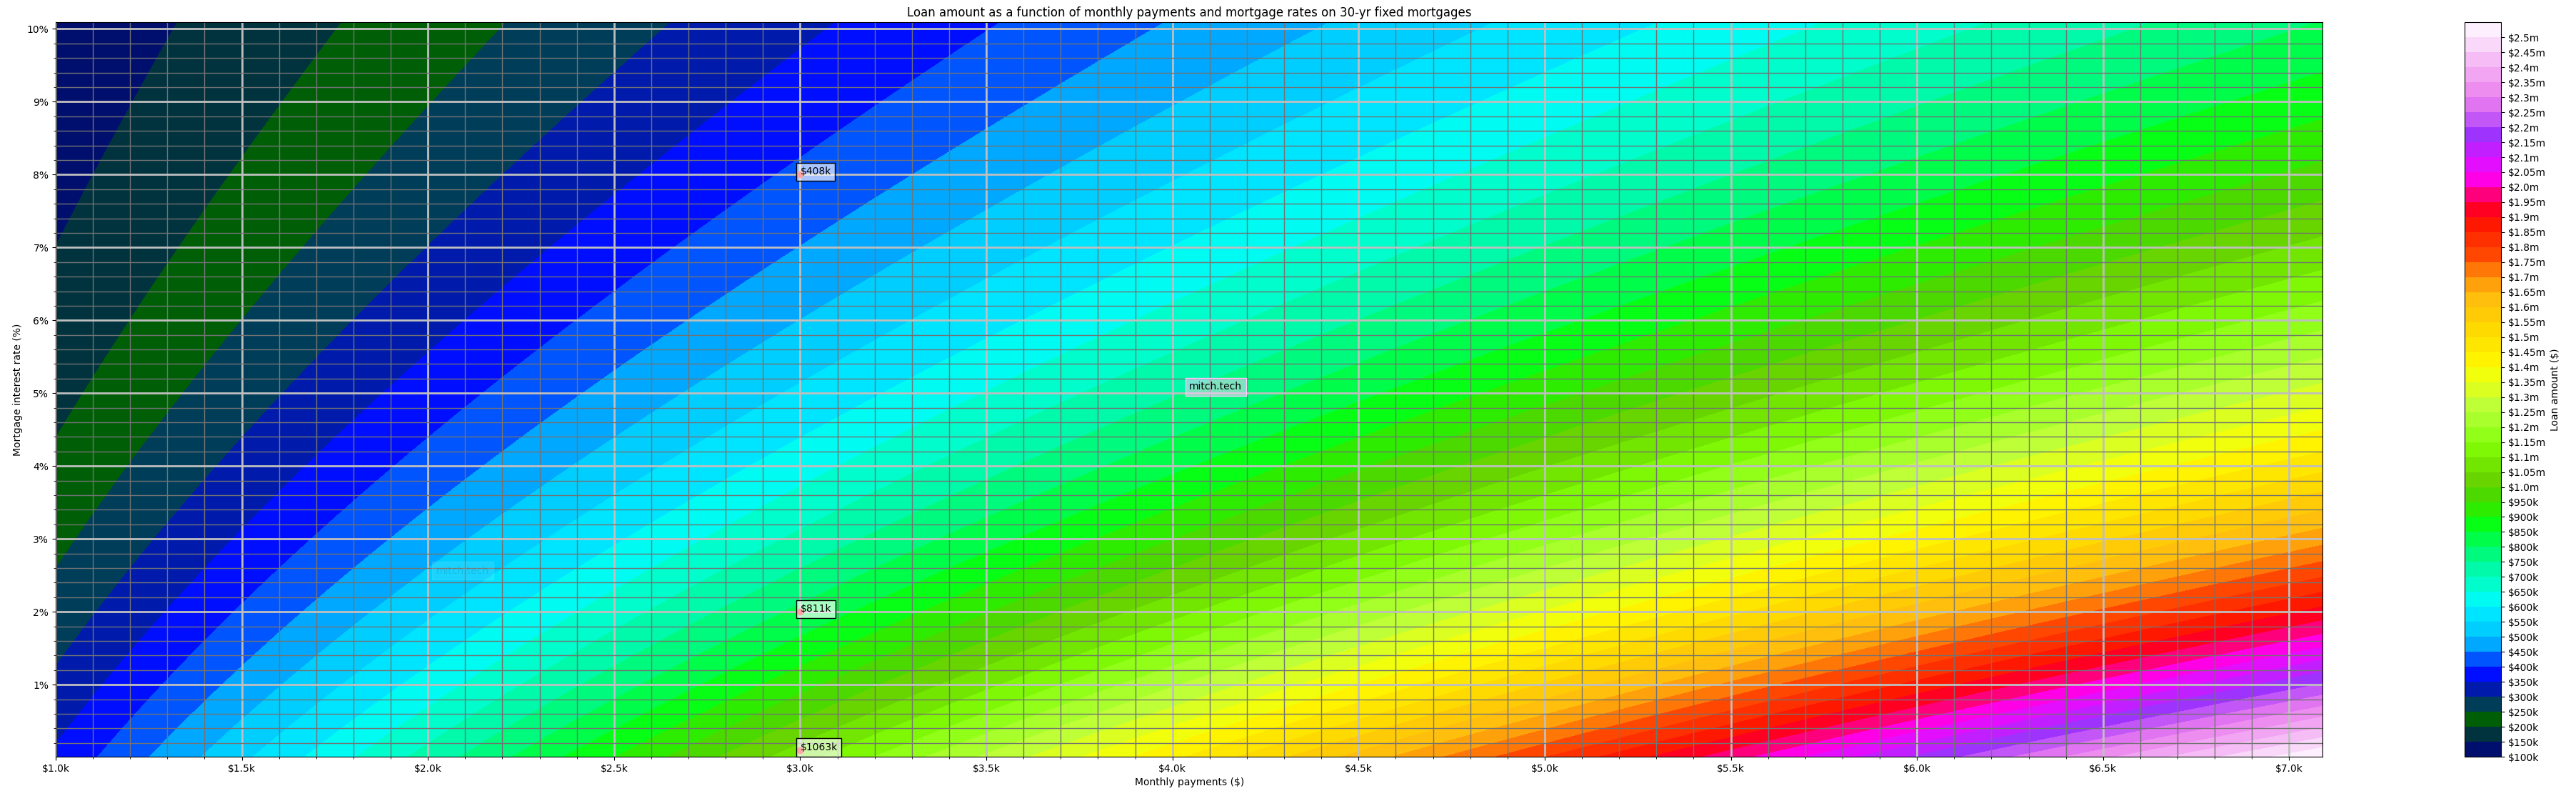
Mortgage principal as a function of monthly payments and rates for a 30 year duration mortgage
With an understanding of how this of a graph works, let’s break into all of the nuances and details that can be observed from it! The three points highlighted on the graph above are all the mortgages that can be afforded with the same monthly payment of $3k, but at three different rates, near 0% at the bottom, 2% in the middle, and 8% at the top (technical aside: the math works better when 0% is not used, so the bottom point is really on an interest rate of 0.1%, but will be referred to as 0% for the purposes of this article, the difference are near negligible). We generally understand that higher interest rates makes monthly mortgage payments higher, but Graph 1 shows us the hard facts of that. A rate of 0% would just be the full amount that could borrowed with on a mortgage that has no interest (referred to hereafter as a no-interest mortgage) where entire principal equates to how much would be paid. We could also arrive at this number by simply adding up all of the payments made over the lifetime of the mortgage, this would be calculated multiplying $3k a month times 30 years. If you are paying $3k a month for 30 years this totals out to the mortgage lifetime cost of roughly $1,063,000, we see highlighted in the bottom point of Graph 1. Just to drive home this point before we build more technical ideas on top of it, in a no-interest mortgage the lifetime cost of paying $3k a month would be around $1,063,000 and the principal (size of the mortgage we access) we would receive would also be $1,063,000; as we increase the rate the lifetime cost of the mortgage stays the same but the principal we receive starts dropping, the difference between what we pay for the lifetime cost and what we receive in the principal is the total interest payments that we make to the mortgage lender/bank. We can measure the impact of interest rates on our personal finances directly by comparing the amount of principal we receive versus the amount of interest we are paying over time. Going from a rate of 0% (bottom point in Graph 1) to a rate of 2% (middle point in Graph 1) that same lifetime cost of $1,063,000 will no longer give you a principal of $1,063,000, but it will give you a principal of $811,000, as shown on the middle point in Graph 1. Going from a rate of 0% to 8% that same lifetime cost of $1,063,000 will only give you a meager $408,000 of principal, as shown on the top point in Graph 1. The difference between the lifetime cost and the principal is the total dollar value of the interest that you are giving directly to the lender/bank over the lifetime of the mortgage. At a 0% rate, the difference between the lifetime cost and the received principal is $1,063,000 – $1,063,000 = $0, hence 0% is a no-interest mortgage. Looking at the 2% rate , the difference between the lifetime cost and the received principal is $1,063,000 – $811,000 = $252,000. This means that if you borrow $811,000 at a rate of 2% you must pay that back the $811k plus an additional $252,000 of interest to the bank. Now turning that up to a rate of 8%, the difference between the lifetime cost and the received principal is $1,063,000 – $408,000 = $655,000. This means that if you borrow $408,000 at a rate of 8% you must pay that $408k back plus an additional $655,000 of interest to the lender/bank. At this point you are paying more in interest than for the money you borrowed! This brings takes us to the first major take away of this article (that we will circle back to later), that the interest rate of the mortgage is generally more important than the price of the house! Ignoring the lifetime cost of the mortgage for a moment, we see from the Graph 1 that on a 30 year fixed mortgage a monthly payment of $3k will allow you to borrow $811k when rates are at 2% and allow you to borrow only $408k when rates are at 8%. This highlights a general rule of thumb in the mathematics of interest rate dynamics of a 30 year mortgage, for a fixed monthly payment, a 6% increase in the rate halves the principle since the rest of the payments directly go to interest (this applies moreso at a rate of 10% and under). Feel free to look around Graph 1 and observe this, a 6% rate increase (e.g. 0% to 6%, 2% to 8%, and 4% to 10%), for any specific monthly payment, halves the principal for a fixed monthly payment. Circling back to how the interest rate can be more important than the purchase price lets look at example situation 1.
situation 1:
rates vs price
A house that you are really interested in buying is offered at a selling price of $400k (we can assume there is no down payment in this situation since we are just looking at the mortgage itself, but will include down payments in a situation 3 in a later section). If rates are around 2%, and the housing market is very competitive, your best chance of purchasing that house is to add +$100k to better your offer. This would increase your purchasing price to a total of $500k. While it is not fun to pay more than asking, we saw this happening regularly in 2020 and 2021 as the American housing market stared favoring the sellers, hence it was a sellers market, wherein had buyers were paying way more than the asking price. Referring to the Graph 1 again, a rate of 2% and a mortgage of $500k, we can see that your monthly payments would be about $1,800. That monthly $1,800 results in a lifetime cost of the mortgage of $648,000 ($1800 * 12 months * 30 years).
Let’s fast forward to the end of 2023 where instead of the low rate of 2%, rates have skyrocketed to around 8%, and the housing market is not very competitive (thus it was a buyers market). Now there are not as many people trying to buy the same house you were really interested in, there is a good chance you could talk the seller down by -10% ($40k) of the current asking price. If you were able to get the seller to take 10% off of the purchasing offer, this would decrease your cost of purchasing the house to a total of $360k. Referring to Graph 1 again, a rate of 8% and a mortgage of $360k would put your monthly payments around $2,700. That monthly $2,700 results in a lifetime cost of the mortgage of $972,000 ($2700 * 12 months * 30 years). A popular misconception of the American housing market in 2022-2024 was that due to all of the buyers paying so much money over the asking price, the housing market was overvalued. While real estate asset evaluation is a very complex topic that is beyond this discussion, many Americans believe that the best financial decision is to wait till housing prices decreased before they purchased a house. Let’s say that this is what you believed in our situation here, and by waiting for the market to become less competitive you were able not pay +$100k over the asking price (+20%), but instead, save –$40k on the asking price (-10%) when purchasing this house just a year or two later. By waiting for the is opportunity you effectively saved a total of $140,000 on the purchase price of the house! However, was this $140k upfront savings worth it when the rate is 6% higher (2% vs 8%)? The first key take away point is that the interest rate of a mortgage can be more important than the purchase price of a house. How does this hold up in this situation? That $140,000 savings comes at a monthly payment that is $900 higher ($1800 a month for $500k at 2% minus $2700 a month for $360k at 8%) which would amount to a total lifetime cost of the mortgage that is $324,000 higher ($972k –$648k). That extra $324k is all interest payments that go straight to the lender/bank and not the equity of the house (aka to the ‘principal‘ that you are building). Even though most folks statistically do not live in the same house for 30 years till its fully paid off, this loss happens over time with most of the interest being paid earlier on in the mortgage. We will see how this detriments our equity building over time and put some real numbers on this in a later section.
While situation 1 demonstrates how the rate has more power shaping our financial well-being than the purchase price, there are still other things to consider in a mortgage than the interest rate. The duration of a mortgage is equally important in other ways. Besides the standard 30 year mortgage, the other two durations offered by American banks are 15 years, and less commonly 20 years. The principals we saw in Graph 1 were all for 30 year mortgages, Graph 2 and Graph 3 are of the exact same style as Graph 1, but are respectively for 15 year mortgages and 20 year mortgages
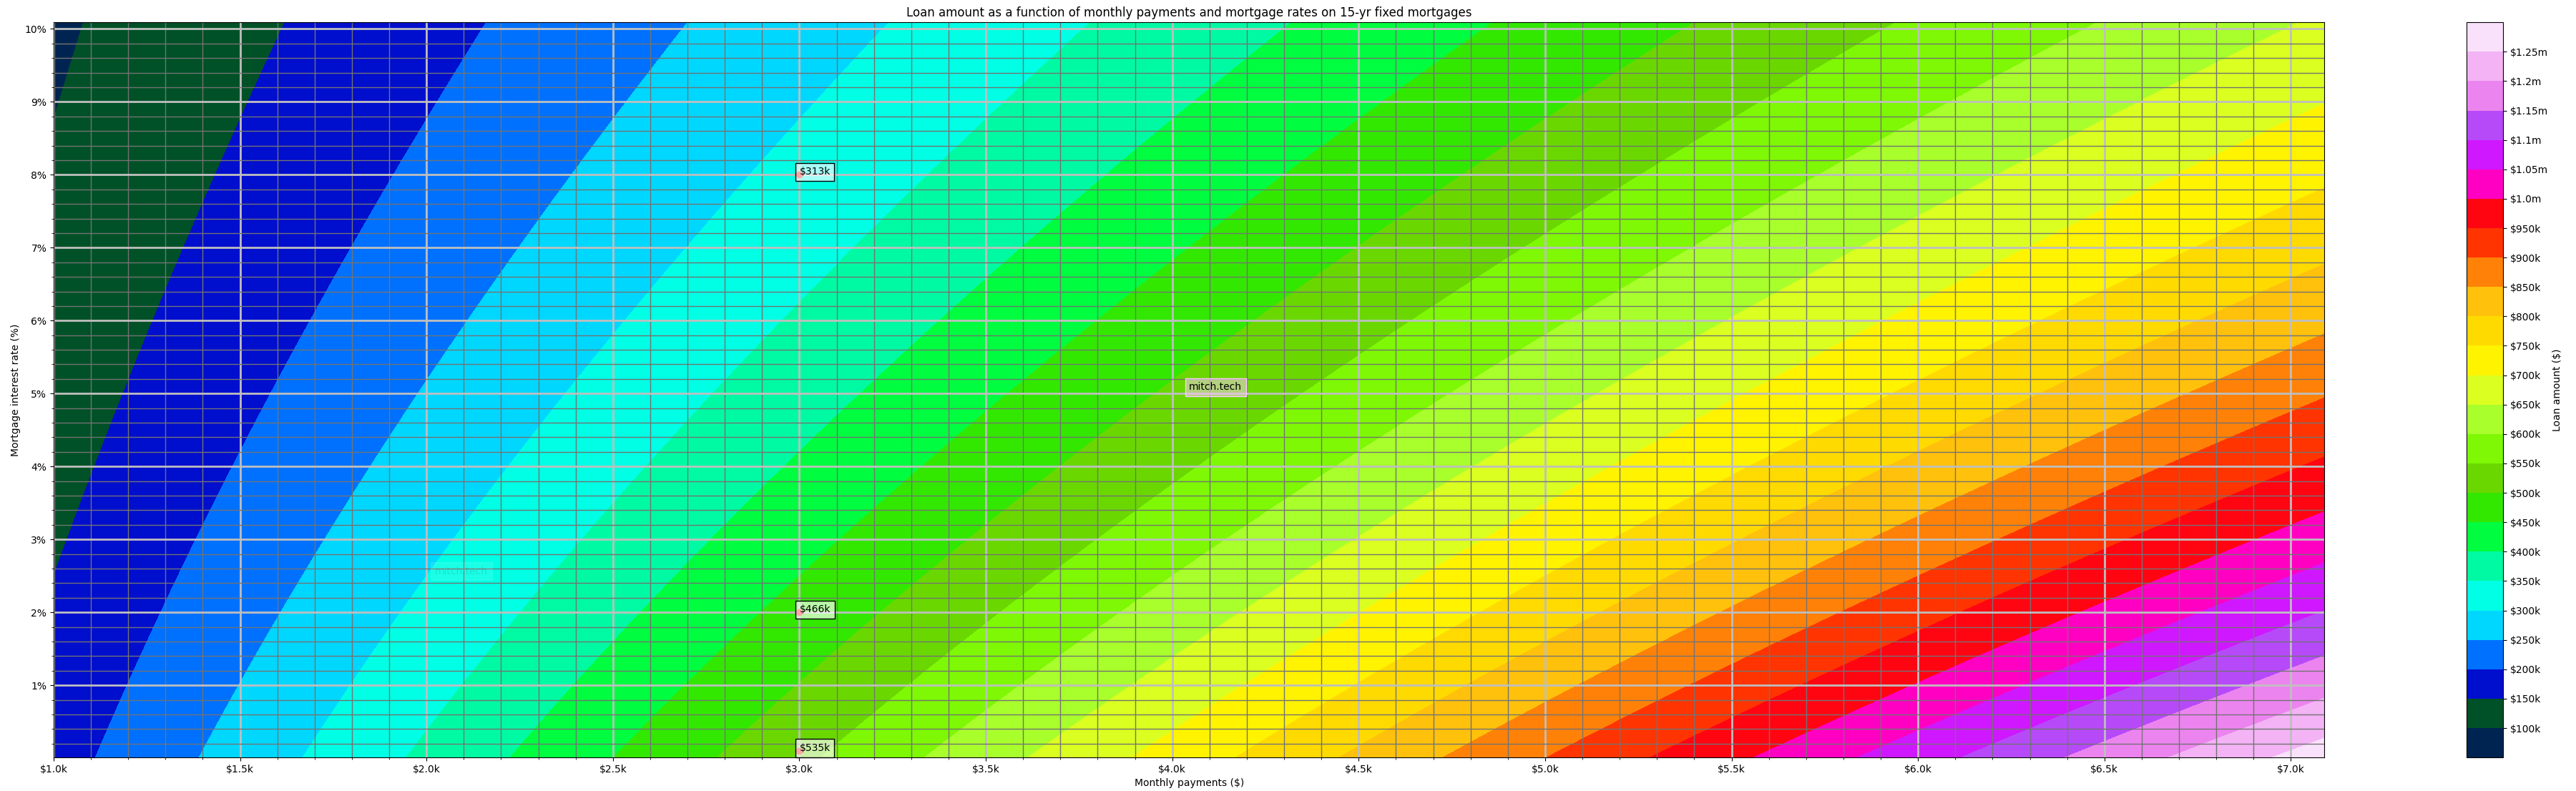
Mortgage principal as a function of monthly payments and rates for a 15 year duration mortgage
Mortgage principal as a function of monthly payments and rates for a 20 year duration mortgage
The impacts that we examined in the 30 year graph are still observed in the 15 year duration mortgages in Graph 2, and the 20 year duration mortgages in Graph 3. However, since their duration is shorter, the compounding impacts of higher interest rates hurt their dynamics less severely. Take moment to look at Graph 2 and Graph 3 to review the numbers in them, the same three points we were discussing before are also highlighted in these graphs. Starting with comparing that same top point ($3k monthly payments, at an 8% rate) across all three graphs. In Graph 1 the 30 year duration gives you access to a mortgage of $408k with an additional $655k of interest. In Graph 3 the 20 year duration gives you access to a mortgage of $358k with an additional $354k of interest. In Graph 2 the 15 year duration gives you access to a mortgage of $313k with an additional $222k of interest. We have touched on the importance of rates, but these number begin to illuminate the importance of duration when it comes to mortgage terms. Diving a little deeper into these numbers we will see exactly how much duration matters by doing a little cost/benefit analysis. Comparing these numbers at a high level shows us that at an 8% interest rate and $3k monthly payments on a 15 year duration we can access a mortgage of $313k with the interest totaling $222k. If we need to keep our monthly payments fixed to $3k per month and interest rates are still at 8%, we can access a bigger mortgage by increasing the duration from 15 years to 20 years. In a 20 year mortgage we can access $358k with interest payments totaling $354k. This means that by keeping everything the same and extending the duration from 15 years to 20 years we can get access to an additional $59k more in principal, but at the cost of an additional $132k of interest payments. While this extra interest is not optimal, this $59k could be the difference between purchasing the house we want, or not! What about keeping everything the same but going from a 20 year duration to a 30 year duration? Extending the mortgage by these ten years will give us access to $50k more principal, but cost an extra $311k in additional interest! Extending the duration of a mortgage gives us access to a diminishing amount of principal, but exponentially grows the amount of interest payments, for the same rate. The way that the principal diminishes and interest grow gets increasingly worse as the interest rate is higher. Is there a way that we could actually quantify this effect, that would give us a general numerical understanding of how the duration and rate (the terms) of a mortgage make it not worth it to have a mortgage with longer durations?
mortgage efficiency:
when is ‘enough’, enough
Let’s explore how the duration of a mortgage impacts us at different rates. In the last section we saw an example of how increasing the duration of a mortgage yielded less and less principal and cost more and more in interest. How could we get a precise evaluation for any duration and rate that we would encounter? Taking the example from the last section (at an 8% interest rate) let’s look at how our choice of duration changes the dynamics of the mortgage. In Graph 4, we take an example of a monthly payment of $1 and see how much principal we can access by extending the duration one month at a time from 1 month to 31 years. This $1 a month scales linearly, meaning that if we want to get a monthly payment of $1,000 we can just multiply all the numbers 1000, or a $3k monthly payment could be calculated by multiplying all the numbers by 3000. How much principal we have access to is shown on the red line, it is a function of how long the duration of the mortgage is.
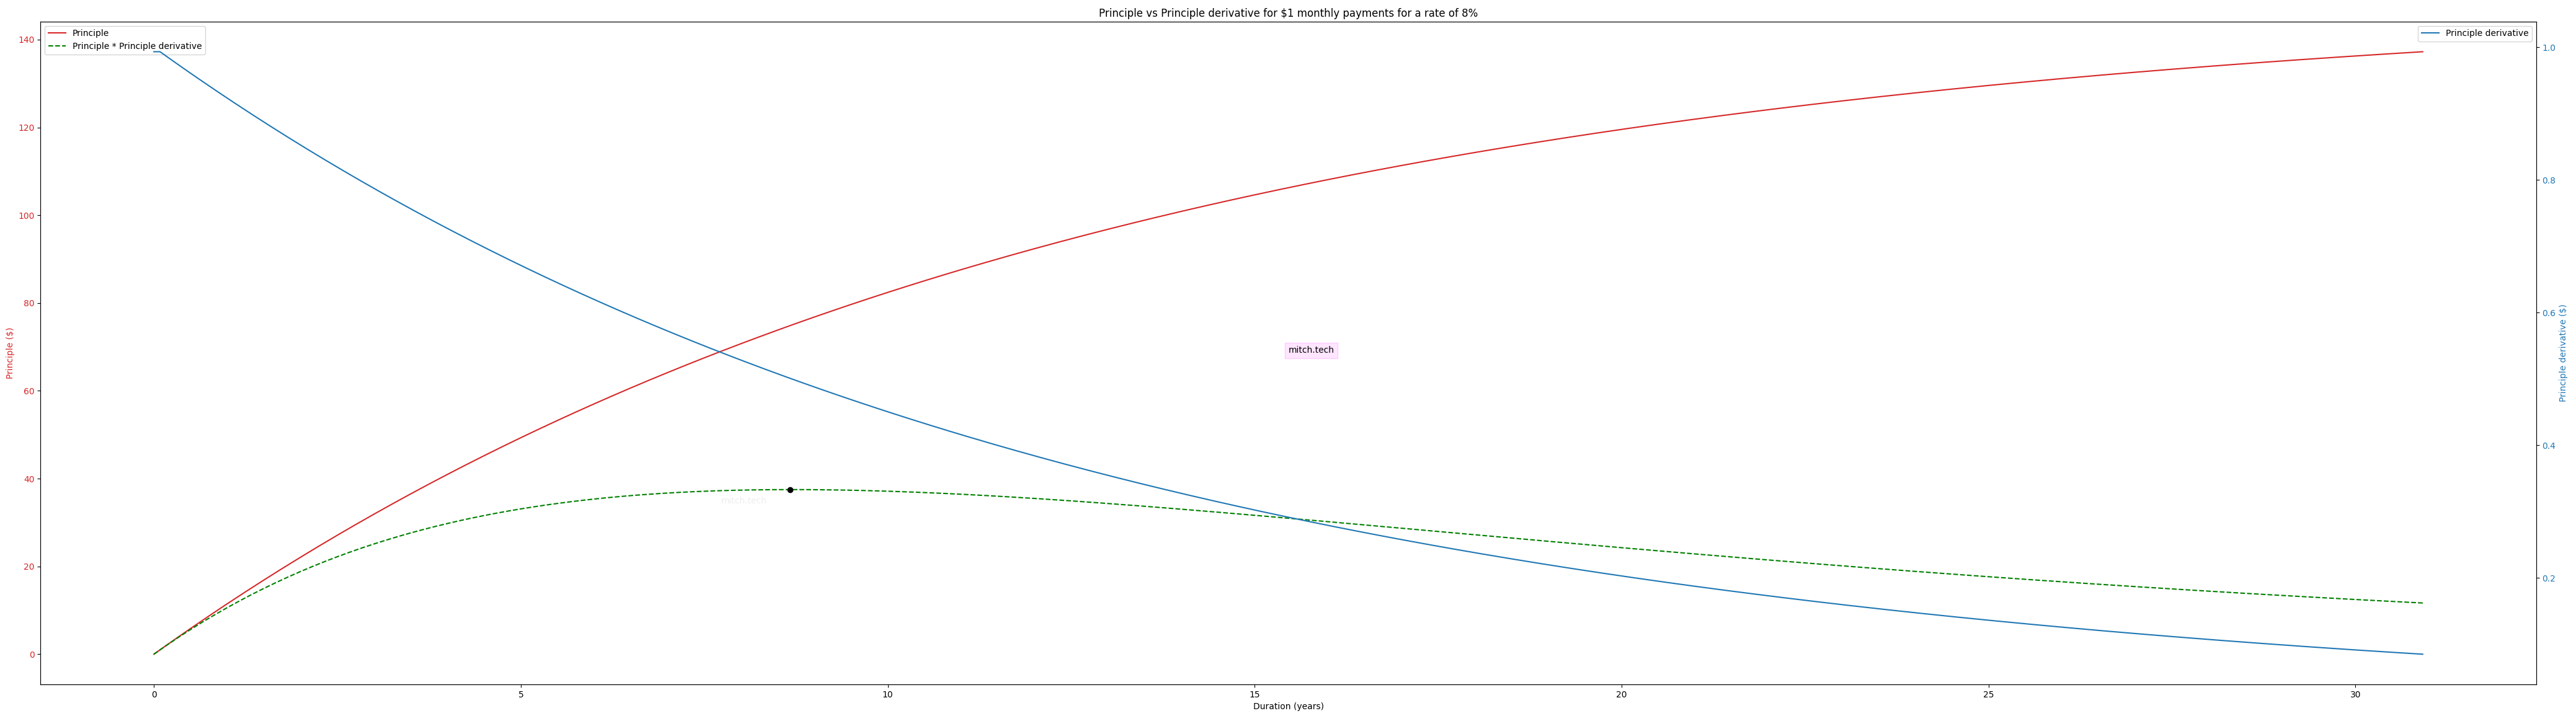
For an 8% interest rate, the amount of principal we can access for every dollar and the duration derivative of the principal creates the Mortgage Efficiency Curve curve with the Peak Mortgage Efficiency marked by the black dot at around 8.666 years on the horizontal axis.
Starting at a mortgage with a 1 month duration, every $1 we make in monthly payments gives us access to $1. While that is not too bad, if we extend the duration to 10 years we can see that that each dollar we pay per month gives us access to an extra $82 in principal! While longer durations give larger principals, we can see that there is a case of diminishing returns as the red line starts to grow progressively slower and eventually flattening out as the duration keeps increasing. This flattening of the red line is because as the duration is increased, we end up paying more and more into interest payments, and therefore get access to less principal over time. Even though the lifetime cost of the mortgage is increasing as we make it longer, an ever increasing amount of our payments go towards the interest payments and leave us with less principal. We intuitively arrived at this same conclusion in the previous section when comparing the top point across the 30, 20 and 15 year durations in Graphs 1-3. Now, we can measure how much less principal we are incrementally getting for each month that we extend the duration. We will do this by taking the derivative of the red curve in Graph 4. The principal derivative is the blue line and shows how much extra principal we would get by extending the duration by one month at a time. When the duration is only one month long, we can see that the principal derivative is roughly $1, meaning that if we extended the duration of the mortgage from one month to two months, we would get an additional dollar in principal for each dollar that we put in in monthly payments. At a duration of 30 years (360 months) Graph 4 shows us that extending the duration of that same mortgage from 360 month by a single month (to a total of 361 months) would only give us an addition $0.09 for each $1 that is paid monthly, at a rate of 8%. A more intuitive way to think about that 9 cents is that the extending the duration by one month from 360 to 361 months, we can only access 9% of the principal that a one month extension of the duration from 1 month to 2 months. The other 91 cents is going towards interest payments at this duration! This underscores the diminishing benefits of the principal we receive because by increasing the mortgage duration it costs us exponentially more in interest payments. The cost is 91 cents and the benefit is 9 cents. Though this begs the question, for a given interest rate, is there an optimal duration that would get us the largest $ mortgage the without exposing us to making too much interest payments? To answer that question, the empirical result I have found is will be called Mortgage Efficiency.
Graph 4 also has a third line on it, this dashed green line is the Mortgage Efficiency Curve for an 8% interest rate mortgage. The Mortgage Efficiency Curve is calculated simply multiplying the principal with its own duration derivative (the points of the red line multiplied by the points of the blue line) at every point in the duration. The Mortgage Efficiency Curve is our answer to finding the largest duration (and therefore the largest $ mortgage) while also considering the diminishing benefits and increasing costs we would get by increasing the duration. In Graph 4 there is a black dot that shows the highest point of the Mortgage Efficiency Curve, we can call this the Peak Mortgage Efficiency. While the actual dollar value that the Peak Mortgage Efficiency is at a value calculated by: (principal * principal derivative), it does not have any real interpretation on the vertical y-axis, its position on the horizontal x-axis shows us the duration that a mortgage with an 8% interest rate would be most efficient. In this case we can see that the Peak Mortgage Efficiency sits at a duration of 8 years and 8 months for a rate of 8%.
We can now make a Mortgage Efficiency curve for every single rate! Performing the exact same type of analysis, Graph 5 shows the same three lines and one point for a rate of 2.5%. The Mortgage Efficiency Curve of Graph 5 also has its Peak Mortgage Efficiency marked by the black dot, and in the case of a 2.5% interest rate is shown to be at a duration of 27 years and 9 months.
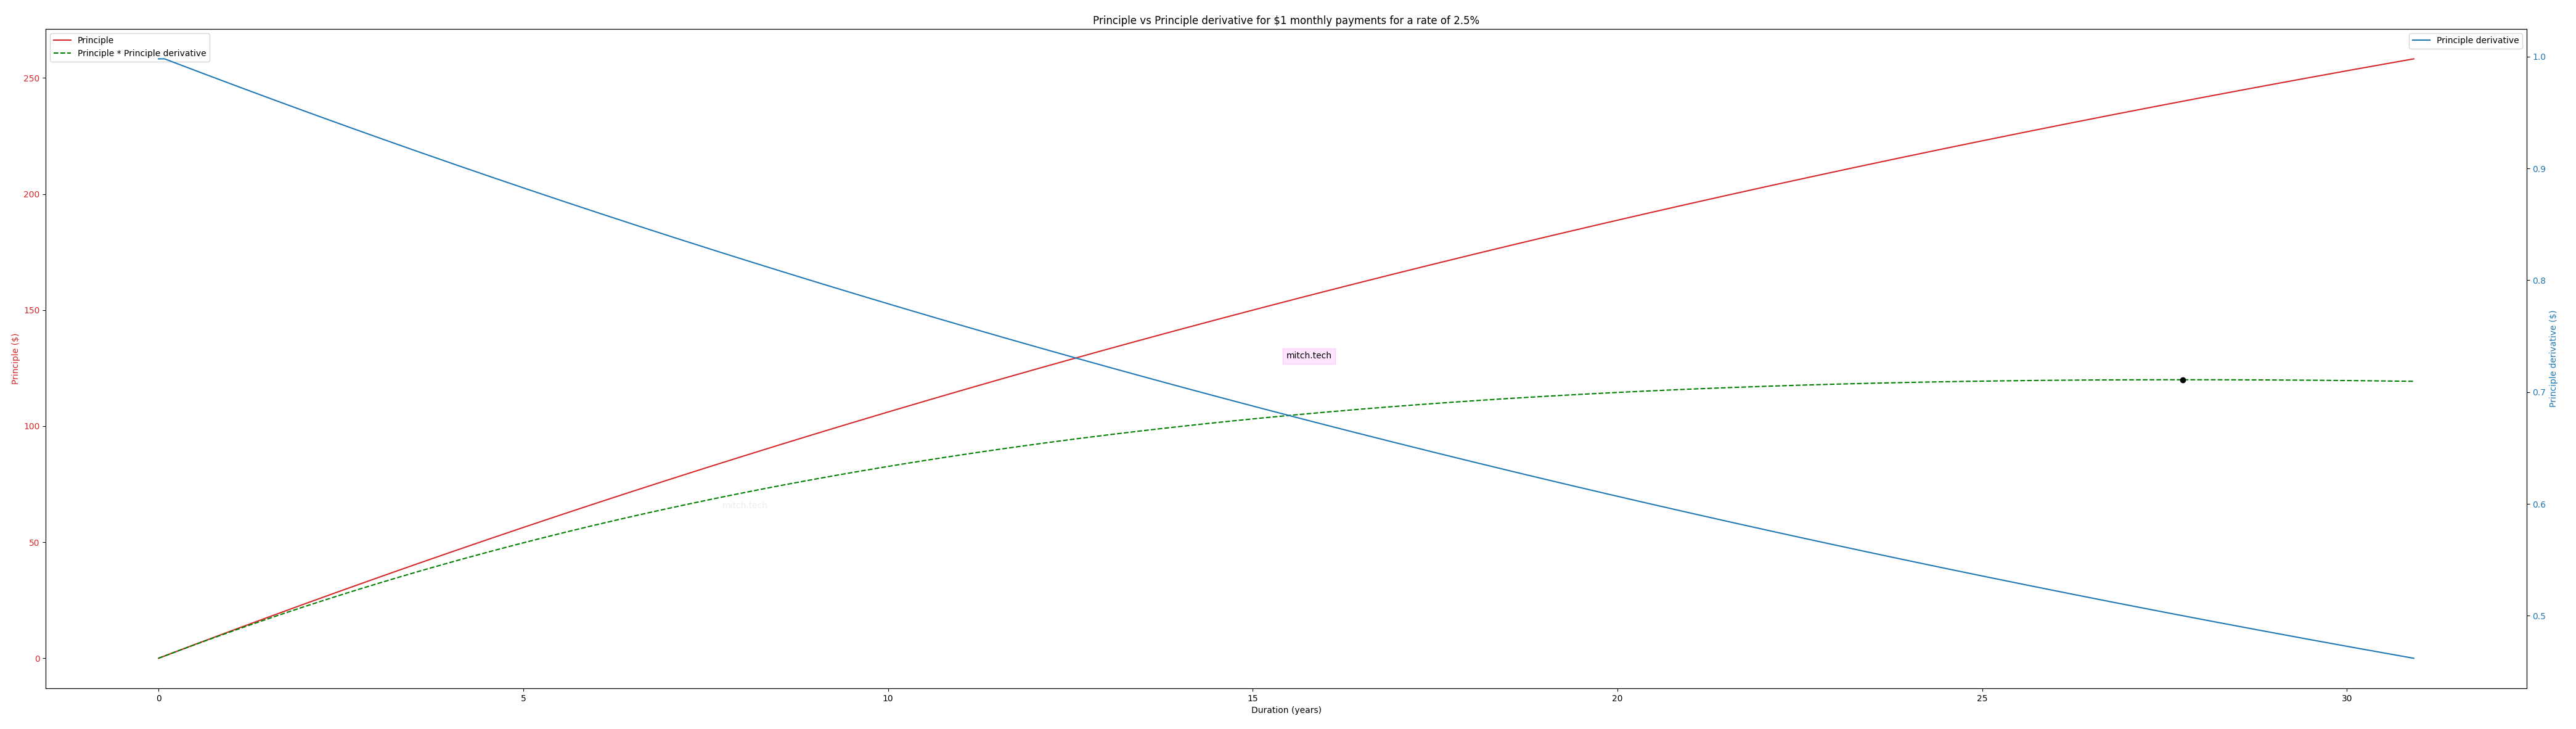
For an 2.5% interest rate, the amount of principal we can access for every dollar and the duration derivative of the principal creates the Mortgage Efficiency Curve curve with the Peak Mortgage Efficiency marked by the black dot at around 27.75 years on the horizontal axis.
Comparing the green dashed lines of the Mortgage Efficiency Curve from the 8% case from Graph 4 and the Mortgage Efficiency Curve of the 2.5% case in Graph 5, we can see that the green lines sit at different levels along the vertical y-axis. This is because the Mortgage Efficiency Curve is empirically derived does not have a real interpretation on the vertical y-axis. This poses a problem though, if all of the curves and their Peak Mortgage Efficiencies sit at difference levels on the vertical y-axis (for my math nerds out there, this rederived axis is effectively dimensionless), how could we compare the Mortgage Efficiency Curves of one interest rate to another? In order to compare these curves from one rate to another we need to individually divide them all by their maximum value, where the black dot is, or more simply, we normalize the everything by the Peak Mortgage Efficiency. This type of normalization converts each curve from a vertical y-axis that has no meaning to a vertical y-axis which represents the Efficiency Percentage; by converting each Mortgage Efficiency Curve to a Efficiency Percentage of each point to the peak efficiency point we can now compare every Mortgage Efficiency Curve for each rate against all other rates! All the points on the curve below the peak will be described by their percentage to the peak, starting at 0% at the bottom and going up to 100% at the Peak Mortgage Efficiency before going back down to 0%. This also enable us to think about Mortgage Efficiency across every single possible duration and rate at the same time. Graph 6 has done just that for every interest rates from 1% to 11% and every duration from 1 month to 71 years. The interest rate is on the horizontal x-axis, the mortgage duration is on the vertical y-axis, and the color that is at any point shows the Efficiency Percentage (in units of %, which is a normalized dimensionless axis) of a mortgage with those terms. The black line is the Peak Mortgage Efficiency Curve itself (as it is a collection of the black dots from the Graphs 4-5 and every rate in-between and beyond).
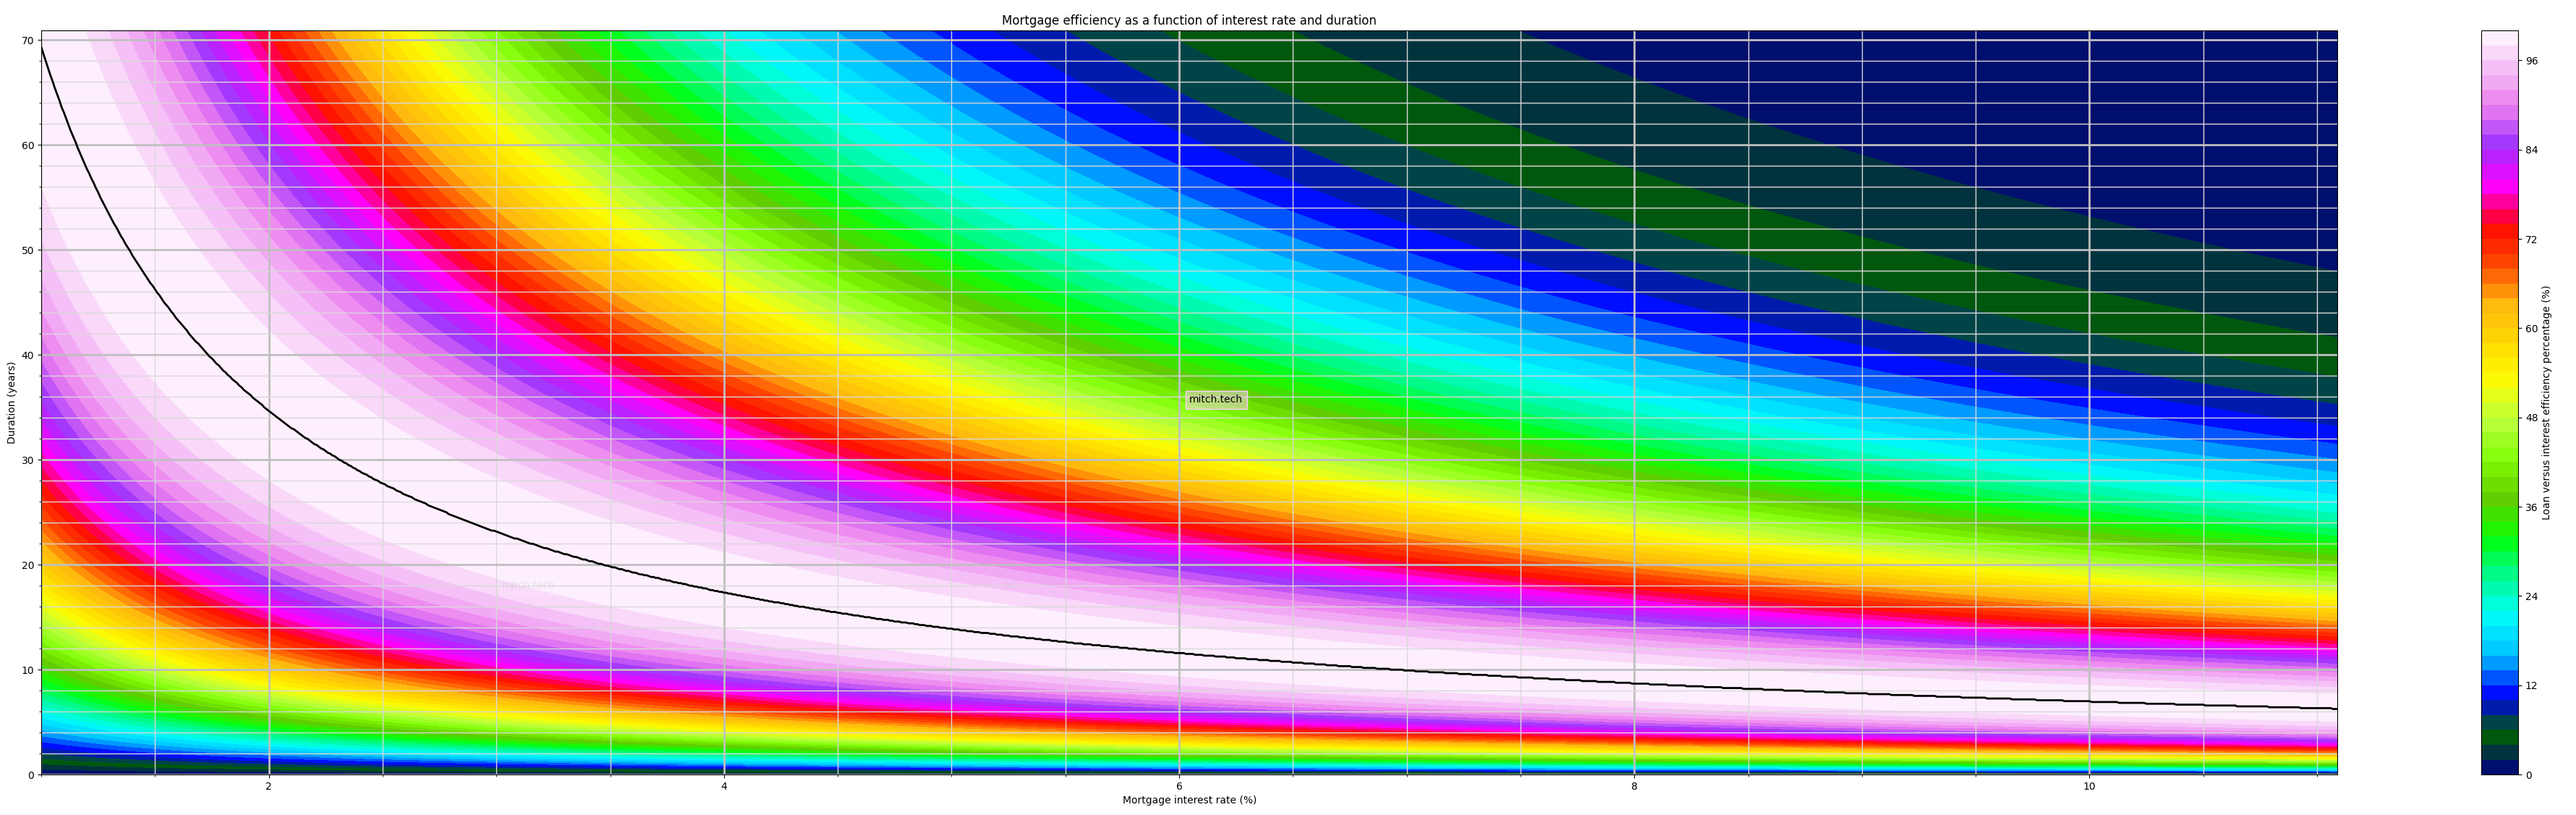
Mortgage Efficiencies (%) for every mortgage with interest rates from 1% to 11% and every duration from 1 month to 71 years.
Graph 6 is a collection of the dashed green lines from Graphs 4-5 for every rate! If you take the dashed green line for 8% (in Graph 4), it is plotted vertically where 8% is marked on the mortgage interest rate axis. Likewise, the dashed green line for 2.5% (in Graph 5), you can see that it is plotted vertically where 2.5% is marked on mortgage interest rate axis. The Peak Mortgage Efficiency for any given rate or duration is just the black dots we saw in Graphs 4-5, but now that we have every interest rate and duration you can see the collection of black dots now forms the black line on Graph 6. This black line is called the Peak Efficiency Curve. To double check that this is correct we can cross-reference the durations of the Peak Mortgage Efficiencies in Graphs 4-5 to see if they are on the correct spot on the Peak Efficiency Curve; the 2.5% interest rate has the most efficient duration at 27 years and 9 months, and the 8% interest rate has the most efficient duration at 8 years and 8 months. Sure enough, the Peak Efficiency Curve intersects 27 years and 9 months when the interest rate is at 2.5% and the black line intersects 8 years and 8 months when the interest rate is at 8%. There are a lot of technical concepts here and we are moving fast, but spend a moment comparing Graphs 4-5 against Graph 6 to see how they interplay. We will now do a deep dive into Graph 6 and see what nuances can be gained, first doing a rough cost benefit analysis. Having mortgage terms on the left/bottom side of the black Peak Efficiency Curve means that we can increase the duration of the mortgage to get a greater benefit (larger $ of principal) without taking on too much of the costs that excessive interest payments would bring. Having mortgage terms on the right/top side of the black Peak Efficiency Curve means that the duration is too long and we are taking on too much costs of extra interest rate payments while the benefits of a larger mortgage are proportionally diminishing. Since everyone is in a different financial situation and cannot always choose the terms of the mortgage, the Mortgage Efficiency Graph may serve as a curiosity for most of us, but for those who may be able to choose mortgages with different durations we can begin to understand how dramatically our financial well-being could change based on where the terms of our mortgage sits on Graph 6. For those of us who are in a position of buying a house, or refinancing a house, you can use Graph 6 to help inform your choice as to what mortgage duration best helps you the most. Anecdotally, I feel like stating at a Mortgage Efficiency above 85% (the dark magenta bands) is ideal, but this is just my personal judgement based on purely the numbers alone and is not financial advice or guidance). The second big takeaway message that this article conveys is hidden in plain sight in Graph 6, that it is optimal to take short duration mortgages in high interest rates and long duration mortgages in low interest rates. When looking at the position of the Peak Mortgage Efficiency Curve (black line) across different rates, it could provide a starting point for the exact numbers of the mortgage term that could be optimal for us. Inflation is another compounding factor to consider here, as the value of our money decreases over time the dollars that we can access today are of more value than the very same dollars in the future. In this case, the ability to access large amounts of money at low rates and pay them back slowly over a long duration mortgage also inherently implies that the dollars that we pay them back with over time are effectively ‘cheaper’ (as purchasing power is continuously eroded by inflation). While the devaluing of our money by inflation is a very complex topic (that the Federal Reserve is still attempting to understand!), it is just worth mentioning here that this compounding effect can work to our advantage when borrowing money at low interest rates and long durations, as the decreasing value of money acts as a tailwind when repaying the lender/bank.
quick maths:
a numbers review
For the math nerds out there, we can take the Peak Mortgage Efficiencies along the ridge of the black line and fit a curve to it if we would like to use it later without deriving every single data point again. The formula to that curve fitting applies to applies to the domain shown in Graph 6, as rates approach zero the peak duration diverges to infinity, and as rates approach infinity the peak duration asymptotes at zero. The function of the fourth order fit curve, for the independent duration variable (x), and the dependent rate variable (y) is:
y = 0.86ln(x)^4 – 7.9ln(x)^3 + 31.5ln(x)^2 – 68.2ln(x) + 69.2For the python nerds out there the corresponding python function is:
peak_mortgage_efficiency_curve = lambda x: 0.86*(numpy.log(x)**4) – 7.9*(numpy.log(x)**3) + 31.5*(numpy.log(x)**2) – 68.2*numpy.log(x) + 69.2moving towards real life:
get your equity together
Putting all of this together I can already hear folks asking, “that is all great information, but the average American moves houses every 5-10 years, how relevant is all of this information if folks are not staying in the same house long enough to fully pay it off in 30/20/15 years?” That is a very fair question, and in an interesting twist we will see how the duration of a mortgage has a massive impact on our financial futures, and in common cases of moving before the the mortgage is paid off, is more important than the rate! Home ownership is widely touted as successful path toward to building lifelong savings/wealth, when compared to renting. The two most common ways that wealth is built through home ownership are widely recognized as
1. house appreciation
2. building equity in the property, also referred to as your principal
Appreciation is the idea that at some point after owning a house for long enough, and/or improving it in some way, we can sell the house for more than we purchased it for. This is a massively complicated question that intersects real estate strategies, macroeconomic conditions, chance & luck of your local housing market, and a number of other complex factors that entire companies spend their time researching (and regularly failing at, e.g. Zillow in the 2020-2023 time range when buying up houses and selling them just a couple years later at a loss). The topic of appreciation is quite significant and is too much to take on here, but I would like to address the equity building side of the savings/wealth building equation since it is mathematically predictable but many folks understand its mathematics poorly. Equity building is the idea that as we pay off our mortgage every month, we begin to own a larger share of the financial value of the house (we are paying the lender/bank back and gaining the principal which we own) which is accomplished by the monthly payments that accumulate over time. Eventually, when the house is sold we do not give back the entire purchase price of the house back to the bank/lender, we get to keep the percentage of the principal we have already paid off. This idea is much more straightforward to explore, but despite how omnipresent it is in the common advice we rarely see the exact numbers behind this. While the weak force of equity building is absolutely true, the exact numbers behind it can make or break our financial well-being because of a number of factors we explore together. To start this discussion, let’s address a general question: “I purchased a house for $X amount of dollars, at Y% interest rate, and have been paying it off for Z number of years, exactly how much principal ($) do I actually own in my house due to the equity building have I accomplished so far?”. This question can be answered by the mathematics of the amortization curves that drive the dynamics of mortgage mathematics. In Graph 7 we see the answer to this for mortgages with durations of 15, 20, and 30 years, and rates at 2, 4, 6, and 8%. The 15 year duration is shown in the solid lines, the 20 year duration is shown in the dotted lines, and the 30 year duration is shown in the dashed lines. The 2% interest rate is shown in the black lines, the 4% interest rate is shown in the red lines, the 6% interest rate is shown in the green lines, and the 8% interest rate is shown in the blue lines. The big black horizontal lines show the percentage of the levels of principal that you own, the horizontal black lines sit at 25% ownership, 50% ownership, and 75% ownership.
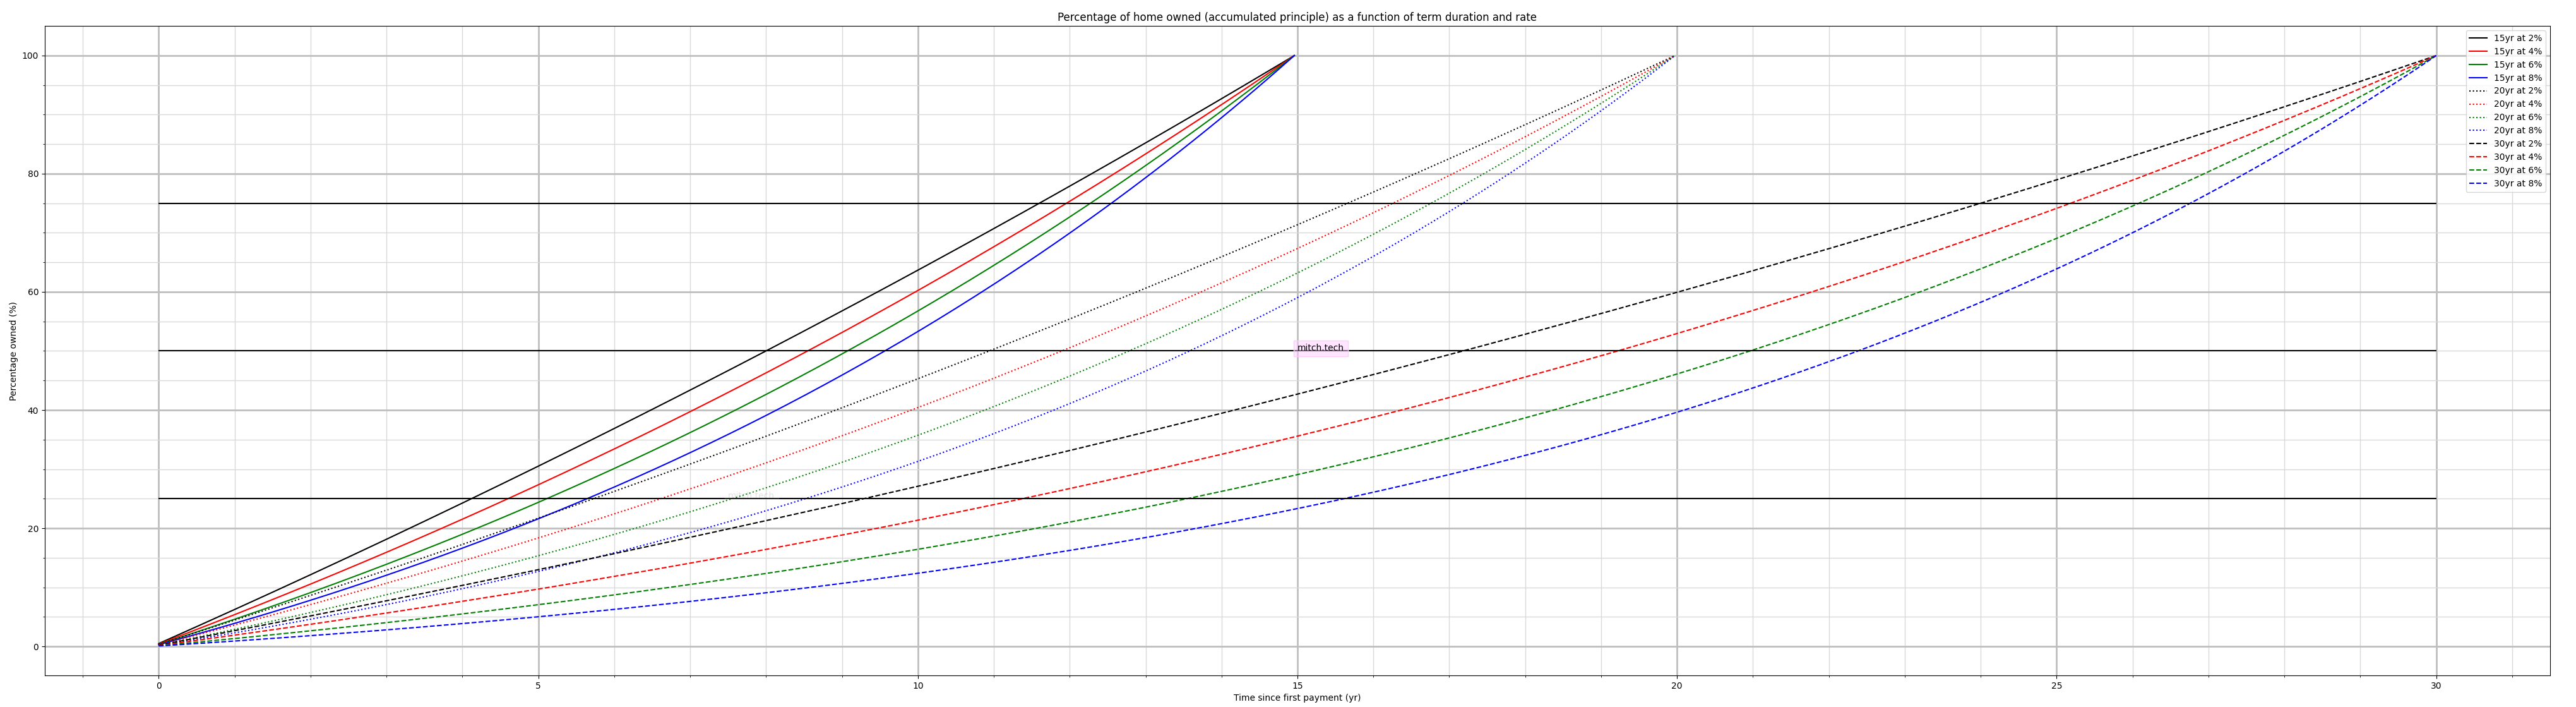
The percentage of the built up equity is shown for mortgages with durations of 15, 20, and 30 years, and interest rates at 2, 4, 6, and 8%.
Taking a look at Graph 7 quickly we can see that at a given time (how long you have been paying your mortgage for) the amount of the principal you own is impacted more heavily by the duration of the mortgage than the rate of the mortgage. Generally speaking, we might expect the shorter duration mortgages to yield more principal as time goes on since they mature (end) sooner because you are likely making larger monthly payments. However, we often miss a key fact in that conversation about the compound effect of interest rates that end up hurting us, especially in the infamous 30 year fixed mortgages. The amortization curve not only makes us pay large amounts of interest early on, but with the longer the duration of the mortgage, the higher the proportion of interest we ar1e paying at any given point in time. To state this directly, this means that when we sell our house in 5-10 years, we are paying a much larger proportion of interest on a 30 year mortgage than a 15 year mortgage if everything else is equal. Said another way, longer duration mortgages not only imply consistently heavier interest payments, but they accomplish that by adding in larger proportions of interest payments earlier on. Since the monthly payments on a short duration mortgage would be bigger (where you have to pay back the money faster over a shorter period of time) than a longer duration mortgage (where you can pay it back slower over a longer period of time), I would like to highlight how the burden of the increased interest payments disproportionately takes more and more away from your principal with longer mortgage durations. This is because longer duration mortgages gives you heavier exposure to the interest rate for a longer period of time, thus increasing its burden at every point. To demonstrate this lets look at situation 2.
situation 2:
damaging combo of rate and duration
In situation 2 we look at a homeowner who has taken a $500k mortgage at an 8% rate and held it for 10 years. How much equity they have built up at that 10 year mark for a 15 year, 20 year, and 30 year mortgage? We can get the exact numbers of these in Graph 7. With a 15 year mortgage, that homeowner has built up 52% equity in that house which corresponds to a principal of $260k, in a 20 year mortgage that homeowner has built up 31% equity in that house which corresponds to a principal of $155k, and in a 30 year mortgage that homeowner has built up 12% equity in that house which corresponds to a principal of only $60k. To understand the harmful interest compounding that duration puts on our equity building, let’s juxtapose these same 3 values, but at a rate of 0% (no-interest mortgage) instead of 8%. At year 10 of a 15 year mortgage the home owner would have built up 66.6% (or two thirds) equity, and at year 10 of a 30 year mortgage they would have built up 33.3% (or one third) equity. In a no-interest mortgage that is 10 years in, we see that the built up equity on a 15 year mortgage would be twice the size of a 30 year mortgage, which is expected because the monthly payments would be twice as large. When we compare this to the 8% interest rate example from before, year 10 of a 15 year mortgage corresponds to 52% of equity built while year 10 of a 30 year mortgage corresponds to 12% of equity built. Since the home owner is exposed to more of the interest rate in the 30 year mortgage, the proportionality of the house that they own is much less. At the 10 year mark, where we would expect that we would have built up half as much equity when comparing the 15 and 30 year terms (33.3% / 66.6%), we see that the home owner actually has 23% (12% / 52%), less than a quarter, of the equity built up when rates are at 8%. This is an important consideration of the home owner’s financial well-being if they intend to sell their house within 10 years.
While situation 2 only demonstrates the 10 year mark across three durations, and shows how higher interest rates cause much slower equity building in longer duration mortgages, could there be a more applicable example? Situation 3 begins to show how choosing the right duration could set you on a better financial path, even when selling your house before fully paying it off and includes other real life considerations that make this important to think about since it is more realistic and not just some academic number crunching.
situation 3:
putting it all together, in real life
You are at the heart of situation 3 and you are looking at houses to buy. You have $50k saved up for a down payment of a house, plan to make monthly payments of $3k, and interest rates are currently at 8%. There are 2 houses that you have settled on, house A and house B, but cannot decide which one. house A has a purchase price of $400k, and house B has a purchase price of $450k. That extra +$50k of the house B does not seem like a crazy amount more expensive relatively speaking, after all, it is only about 12.5% more expensive than the house A. What are the different financial paths that that $50k difference will take you down, if you buy house A or house B? Looking at Graph 1 and Graph 3, we respectively see that with $3k monthly payments, a 30 year mortgage gives you access to $408k of principal and a 20 year mortgage gives you access to $358k of principal. Right there we can already deduce that house A can be purchased with a 20 year mortgage, while house B can only be purchased with a 30 year mortgage. From earlier in the article we understand how interest payments factor into the lifetime cost of the mortgage when it is paid off fully, but what if you plan to move out and sell it in 10 years (as is most common) for the same price you bought it for? What implications does that have for purchasing house A with a 20 year mortgage or house B with a 30 year mortgage? Let’s do the math for what would happen if you purchased house A: you take on a $350k mortgage at 8% for 20 years, referencing the Mortgage Efficiency Graph (Graph 6) we can see that the terms of this mortgage are roughly 66% efficient. When you sell house A at year 10, Graph 7 shows the percentage of equity you have built is 31% equity, which corresponds to $108.5k (31% of $350k). Over that 10 years you have paid a total of $360k ($3k * 12 months * 30 years) to the lender/bank for that mortgage. Now let’s say you purchased house B and you take on a $400k mortgage at 8% for 30 years, referencing the Mortgage Efficiency Graph (Graph 6) we can see that the terms of this mortgage are roughly 33% efficient. When you sell house B at year 10, Graph 7 shows the percentage of equity you have built is 12% which corresponds to $48k (12% of $400k). Over that 10 years you have paid a total of $360k ($3k * 12 months * 30 years) to the bank for that mortgage (which is the same as house A since the monthly payments are the same $3k either way). This is where situation 3 gets really interesting, comparing how much of the built up equity you receive from selling house A versus house B. Selling house A nets you $108.5k from the equity you built up while selling house B only nets you $48k. You will get an extra $60.5k ($108.5k – $60.5k) back in the sale of house A on a 20 year mortgage versus house B on a 30 year mortgage.
Though, the story gets more interesting than that when it comes to choosing different duration mortgages in real life. Lenders/banks view the duration of the mortgage as additional financial risk because promising to pay them back over 30 years contains a lot of uncertainty for them, but promising that to pay them back over 20 years is 2/3rds of the uncertainty, relatively speaking you are paying them back faster over a shorter period of time. For reducing the amount of uncertainty, and therefore the apparent financial risk to the lender/bank. Because of this, lender/banks typically offer lower rates on shorter duration mortgages!
If situation 3 happened in the real world it is likely that the 30 year mortgage on house B is offered at 8% while the 20 year mortgage on house A is offered around 7%. Doing the math all over again for house A, this lower rate would raise the percent of equity in house A from 31% to 34% at the 10 year mark, which would correspond to a total amount of equity build up of $119k. This brings the total difference of selling house A versus house B to more realistic value of an additional +$71k ($119k – $60.5k) in built up equity, with house A on a 20 year mortgage. To rephrase that in more direct way, accessing that extra $50k by extending from a 20 year mortgage to a 30 year mortgage made the different of having built up $48k in equity versus $119k in equity, before the mortgage was paid off at the 10 year mark. An opportunity cost of $71k ($119k – $48k).
Let’s make this more realistic and consider the effects of appreciation…
Many houses today are often sold for more than they were purchased for 10 years ago. We saw that the opportunity cost of the 30 year versus 20 year mortgages was $71k, but how would this change if there was market appreciation of the houses? Let’s assume that both houses appreciated at the same percentage. Since house B is worth more than house A, house B will benefit more from market appreciation. If the market appreciated 10%, house B could be sold for $495k ($450 * (100 + 10)%) while house A could be sold for $440k ($400 * (100 + 10)%). Going into the math of this, the profit of house B from the appreciation alone would be an additional $45k, while house A would be and additional $40k. The difference of the appreciation of the houses is that for every 10% of market appreciation, house B yields +$5k ($45k – $40k) more in profit than house A. The total picture of how much you would profit is found by adding the appreciation to how much equity you have built up. In the case where the market has appreciated 10%, house A nets $159k ($119k + $40k), while house B nets $93k ($48k + $45k). In this case we can recalculate the opportunity cost and find that it has decreased to $66k ($159k – $93k) from the original $71k we found when the appreciation was 0% (the houses were sold for the same price they were purchased for). This means that the opportunity cost of house A versus house B is going down –$5k, making both houses closer to parity. Looking at this in a more general mathematical sense we can see that for every 10% of market appreciation, the opportunity cost falls out of favor of house A by $5k. Or more simply stated, since house B was originally worth more, it will benefit more from market appreciation than house A. Though, where is the break even point for how much you net (the opportunity cost) in the sale of each house? To find this value we can use our knowledge that for every 10% increase in market appreciation, house B falls more in favor by +$5k (directly meaning house A falls out of favor by the same -$5k). Since house A is in favor by $71k in the 0% percent market appreciation case, we can just divide these values to find out how many 10% increments are needed to make the sale of house B at 10 years more profitable. Doing the calculations ($71k / $5k), the profit from house B at 10 years will be the same if the market has appreciated by 142% (the calculations are: $71k / $5k gives us a value of 14.2, but since these are multiples of 10%, we must multiply 10% by 14.2)! If the market has appreciated by more than 142% in those 10 years then house B would have been a more profitable decision. If the market has appreciated by any less than 142% in those 10 years then house A would have been a more profitable decision.
conclusion:
what have I gained from reading all this
In conclusion I would like to review the key takeaways as well as some other supporting ideas that we encountered along the journey and end with some actionable ideas. Revisiting the two key points from the beginning and touching on some of the other key points throughout the article:
1. The mortgage rate can be more important than the purchase price. Look to lower both as much as you can, but prioritize opportunities to take on mortgages with lower interest rates since this will build more savings/wealth over the long run. Thought it is also good to consider the combination of the rate and the duration because…
2. It is better to take short duration mortgages in high interest rates and long duration mortgages in low interest rates. The benefits of taking on larger mortgages with lower interest rates and longer durations helps us build equity rapidly, but also has the tailwinds of the compounding effects of inflation because the dollar we pay it back with are ‘cheaper’. Though you can still take action when there is high interest rates because…
3. When interest rates are high you can still build equity rapidly by taking on mortgages with shorter durations. Which is in our best interest because…
4. Longer duration mortgages expose you exponentially more to the interest rate of the mortgage. Understanding that higher interest rates and longer durations can erode our financial well-being, which we saw in the cases where…
5. The interest rate of the mortgage changes ‘how much’ (in dollar terms) of a mortgage you can access. As we saw in the first sections, for a 30 year fixed mortgage, every 6% that rates increase corresponds to you being able to only afford half the house (by the accessible principal) because of how much of the interest payments are being subtracted away from the principal. Though, you can still make financially smart choices about the mortgage terms. Your choice can now be informed by the numbers we saw in…
6. The Mortgage Efficiency Graph (in Graph 6), that helps you make more informed choices on your mortgage terms, can have outsized impacts on your financial future.
actionable takeaways:
what to look for
➡This subsection is not investment or financial advice, and only remarks on the numbers reviewed above and generally offered term structures.
Based on everything reviewed in this article some potential actionable steps that could provide benefit are:
• Looking at taking mortgages with shorter durations can help build equity faster
• Taking any opportunities to find lower rates pays off dramatically (e.g. points buy downs, lender shopping, assumable mortgages, and seller concessions)
• Since shorter duration mortgages take on exponentially less interest, refinancing into a shorter duration mortgage may keep monthly payments the same while shortening overall length of the mortgage and, very importantly, lower its lifetime cost
• For whatever mortgage terms are available, the Mortgage Efficiency Graph can assist in finding a rate and duration that positively impacts ones’ finances
• If fully financing a house with a 15 or 20 year mortgage is not possible, it might be worth it to finance as much of the mortgage as is reasonable with a shorter duration and acquire a secondary mortgage for left over dollar amount with a longer duration
Thanks for reading this to the end, I hope that you have both learned something new and also have found definitive numbers for ideas that you previously only had a feeling for! Let me know if there are any other concepts that would be interesting to explore.
#finance
